You can use filter Web Part to pass value to Collabion Charts and then change the view of the chart based on the value to display a subset of data. For example, you can type the name of a region in a Text Filter Web Part and then display the population data of that region on the chart.
Web Part Connection feature is used to filter the charts. Filter Web Parts or any custom Web Part that passes value, can be used to filter chart data in real time.
How filter Web Parts work
In general, connecting a filter Web Part with Collabion Charts works in the following way:
- The filter Web Part is connected to the Collabion Charts
- The filter Web Part provides a value
- The value is passed to a column in the underlying data table of Collabion Charts
- The chart is filtered based on the value
Types of Connection available
Two types of connections are possible between Collabion Charts and filter Web Part:
- Single Value: In this type of connection, the filter Web Part provides single value which is passed to the connected Collabion Chart.
Here is an example. - Multiple Values: In this type of connection, the filter Web Part provides multiple values which are passed to different columns of
the underlying data table of connected Collabion Chart. Here is an example.
Ways to filter Collabion Charts through Web Parts
You can connect a Web Part with Collabion Charts so that the chart data can be filtered based on the filter value in the following ways:
- Choice Filter
- Current User Filter
- Date Filter
- HTML Form Web Part
- Query String (URL) Filter
- SharePoint List Filter
- Text Filter
The process of connecting a Web Part with Collabion Chart is similar for all types of filter Web Parts. Let's take a look at the following two examples to go through the process; it will also help you understand the difference between Single Value and Multiple Value Filtering.
Connect a Text Filter Web Part and Pass Single Value to Collabion Charts for SharePoint
We have built a chart “Country Details” using Collabion Charts for SharePoint Web Part. It shows Population and Population Density of several countries across the globe.
This is the underlying data:

And this is how the “Country Details” chart looks:

Note: To learn how to build a chart; please refer to Introduction -> How to create a chart.
As you can see, countries appear in ascending alphabetical order in the chart. Finding population data about Asian countries or European countries is difficult. Let’s add a Text Filter that allows viewers to filter the chart by “Continent”.
- Insert a Text Filter Web Part on the same SharePoint page on which the chart is configured.

- Text Filter Web Part added to the SharePoint page.

- Click the Web Part menu for the Country Details Collabion Charts for SharePoint Web Part. Click Edit Web Part.

- Edit Web Part pane appears on the right side. Keep the Edit Filter Web Part pane open and proceed to the next step.
- Click the Web Part menu for the Country Details Web Part. Go to Connections -> Get Single Value Filter From -> Text Filter.

Note: If the page contains multiple custom or filter Web Parts, names of all of them are displayed in this menu - you have to select the desired one.
- Connection Settings pop-up window appears; select the field you want to connect the Web Part to (this drop down shows the fields from the underlying data). As we intend to filter the chart according to Continent; we would choose Continent from the Consumer Field Name drop down.

Note1: Be sure to remove pop-up blocks from your browser; otherwise the Connection Settings window will not appear.
Note 2: Provider Field Name is the name of the Filter. In this example, the name of the Text Filter is "Text Filter".
- Click Finish.

- The Text Filter Web Part is now connected to the Country Details chart.

- Save the page.
Type "Asia" in the Filter text box and press enter key. The chart will display the population data of Asian countries only. Type Europe and press enter; the chart will display the population data of European countries and so on.

Connect a Choice Filter Web Part and Pass Multiple Values to Collabion Charts for SharePoint
In this example, we will use a Choice Filter Web Part to pass mutliple values to the chart.
We have built a chart “Country Details” using Collabion Charts for SharePoint Web Part. It shows Population and Population Density of several countries across the globe.
This is the underlying data:
And this is how the “Country Details” chart looks:
Note: To learn how to build a chart; please refer to Introduction -> How to create a chart.
As you can see, countries appear in ascending alphabetical order in the chart. Finding population data about Asian countries or European countries is difficult. Let’s add a Text Filter that allows viewers to filter the chart by “Continent”.
- Insert Choice Filter Web Part to the site page.

- Click Add to insert the Web Part.
- Click Edit Web Part.
- Click Open the tool pane to configure the filter.

- Configure the filter; enter the list of continents as values of the Choice Filter. Check Allow multiple selections options under Advanced Filter Options as shown in the image below.

- Click Apply.
- Click Web Part Menu for the Country Details Collabion Charts for SharePoint Web Part. Go to Connections -> Get Multiple Value Filter From -> Filter: Choice Filter.

Note: If there are multiple filter Web Parts on a page, the menu lists them all; you need to choose the desired one.
-
Connection Settings pop-up window appears; select the field you want to connect the Web Part to (this drop down shows the fields from the underlying data). As we intend to filter the chart according to Continent; we would choose Continent from the Filtered Parameter drop down.

Note: Be sure to remove pop-up blocks from your browser; otherwise the Connection Settings window will not appear.
- Click Finish.
- The Choice Filter is now connected with Country Details chart.

Select Asia and Europe from the Choice Filter list. Click OK.
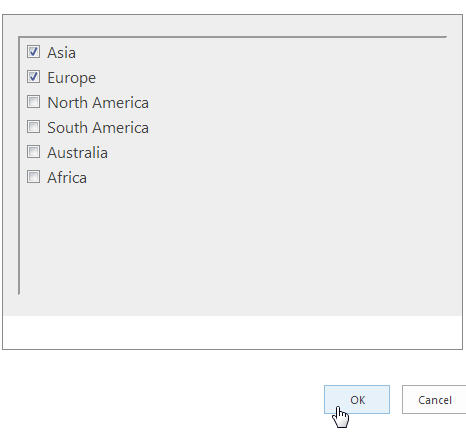
Country Details chart shows population data of Asian and European countries.
