After successfully installing Collabion Charts for SharePoint you need to create web parts to launch the Collabion Charts wizard and create charts. Let us see the steps of how to create a chart in Collabion Charts for SharePoint.
Here we will learn how to:
- Add a Collabion Charts for SharePoint web part
- Create a chart using Collabion Charts for SharePoint wizard
Add a Collabion Charts for SharePoint web part
- After the installation create a new Site Page on you SharePoint site.
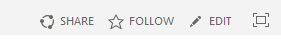
- Click on Edit. placed at the top right corner of the page
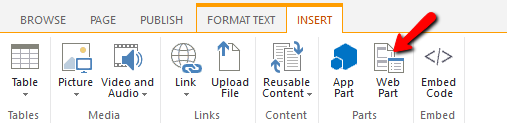
- Click on Insert. Then click on web part
- Select Collabion DataParts for SharePoint.Then select Chart from the List of web parts .
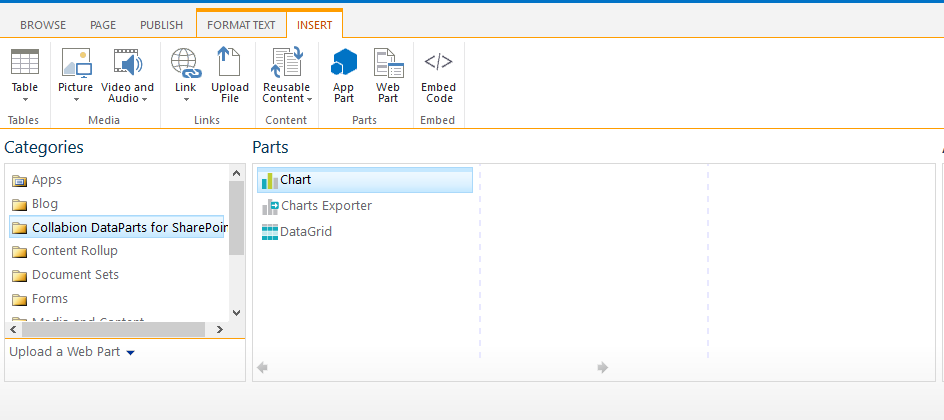
- Click Add button.
- Click Collabion Charts Wizard to launch the wizard.

Create a chart using Collabion Charts for SharePoint wizard
Let us create a chart that depicts the Sales Report of a Gaming Console for three consecutive years. To create a chart the Collabion Charts Wizard allows you to:
- Select the source of data
- Select the data fields
- Add filter to your data
- Group the data
- Select the type of chart
- Customize the configuration of data set(s)
- Add the caption, sub-caption and the axis titles
- Customize the labels, values and the tool tips of the data plots
- Customize the visual properties of the chart
- Configure all the number formatting properties
- Configure the axis grid lines
- Customize the legend
- Configure the settings of the trend lines
- Configure the export settings
- Configure the Chart messages, Hotspot settings, custom attributes and the other rendering settings
To know more about the above settings go through the Collabion Charts Wizard page.
The wizard along with the chart preview appears as shown below:

Click Finish to create the chart and view it in the page. The chart will look as under:
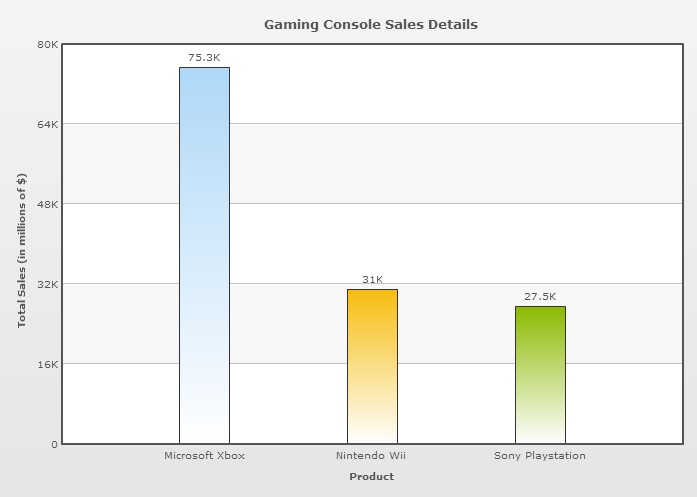
The final chart that appears has a lot of interactivity and is not a boring static chart. Some of the interactivities are as follows:
- Animation sequence
- A rectangular box known as tooltip. The box appears when the cursor is hovered on any of the columns and displays information about the columns
- Multiple level of drill-down if it is configured at the time of creating the chart