Selecting the data source for a chart is the first step to create a chart.
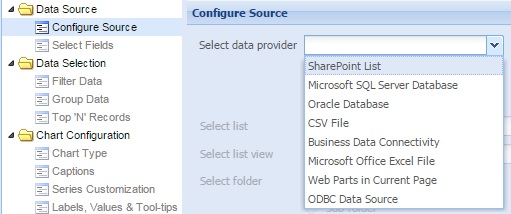
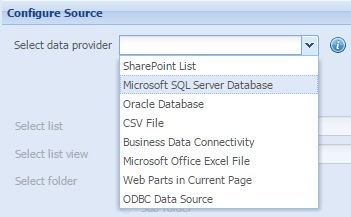
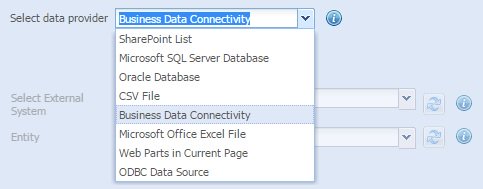
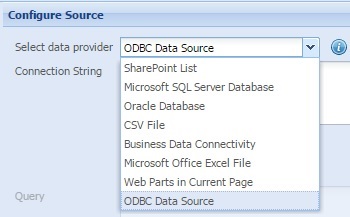
Collabion Charts for SharePoint allows you to create charts using data from various types of data providers. You can choose one of the following data providers:
The steps for getting data from a data source can vary depending on the type of data provider that you are using.
Learn how to:
- Select data from SharePoint List
- Select data from Microsoft SQL Server Database
- Select data from Oracle Database
- Select data from CSV or Text File
- Select data from Business Data Connectivity
- Select data from Microsoft Office Excel File
- Select data from Web Parts in Current Page
- Select data from ODBC Data Source
How to select data from SharePoint List
To connect your SharePoint List and provide data to the chart, follow the steps given below:
- Select SharePoint List in the Select data provider setting.
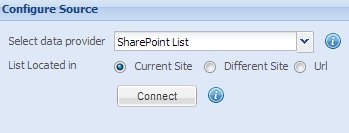
- Next, in the List Located in setting, select any of the following options:
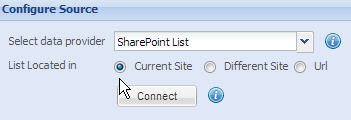
- Current Site: To fetch data from a list which is present on the same site where the chart will be rendered.
- Different Site: To fetch data from a list which is not present on the same site.
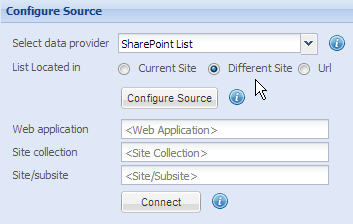
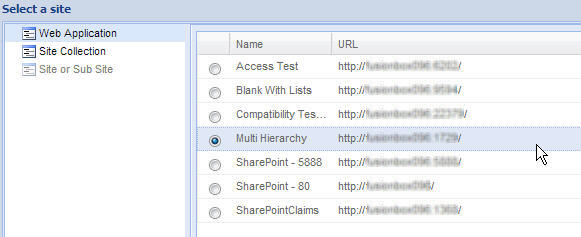
You need to point to the Web application, Site collection and Site/subsite that contains the list. To do this:
- Click on Configure Source button. Select a site window appears. Select the Web Application. Click Next.
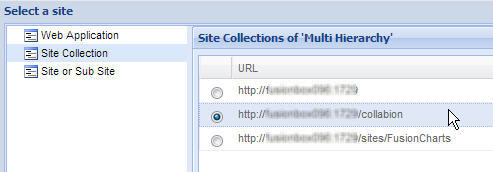
- Select the Site Collection. Click Next.
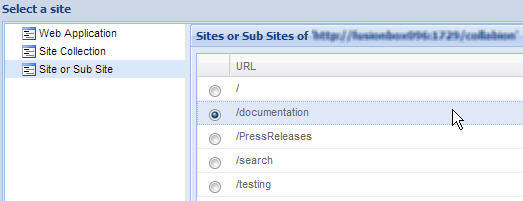
- Select Site or Sub Site under the previously chosen Site Collection. Click Finish.
- Click on Configure Source button. Select a site window appears. Select the Web Application. Click Next.
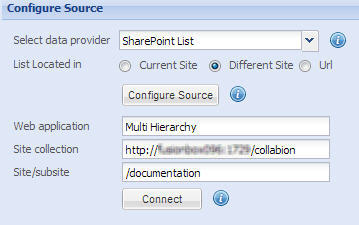
- Url: To fetch data from a specific SharePoint List URL.
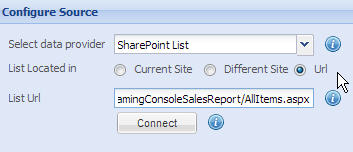
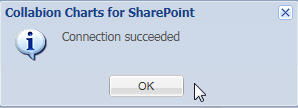
- Click Connect. A message box announces whether the connection is successful.
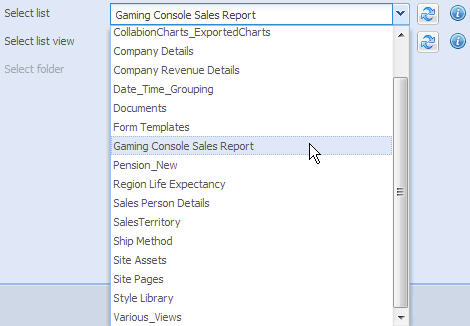
- Choose the SharePoint List containing the data for chart in the Select list setting.
- You can optionally select a View created from the selected Select list view setting.
- If the selected SharePoint List has folders, Select folder option gets activated.
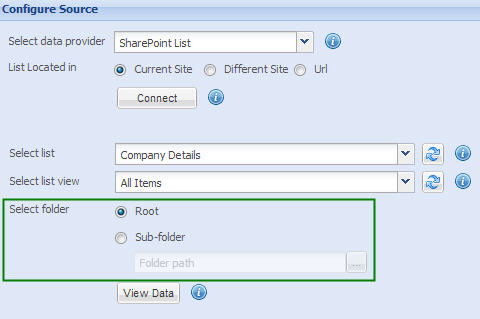
- Select Root to fetch data from the root level of the List. Select Sub-folder to fetch data from any of the sub folders and click the browse button.
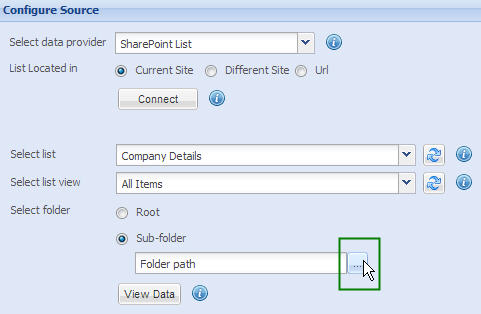
- Folder structure of the SharePoint List opens in a window.
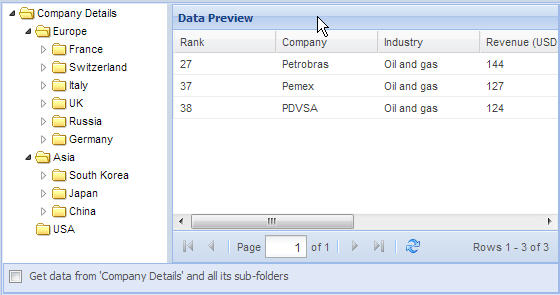
- Select the folder you want to fetch data from. Click OK to continue.
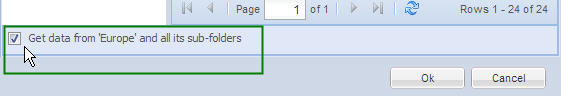
- Click the check box just below the folder navigation pane to select a folder with all its sub-folders.
For example, to select Europe along with all the sub-folders, check the option Get data from 'Europe' and all its sub-folders. Click OK.
NOTE: You can click the Refresh button on the right to retrieve the latest SharePoint Lists and Views.
Finally, you can view the data present in the List by clicking View Data.
You can connect to Microsoft SQL Server Database and provide data to the chart using the following two modes:
- Connecting through SQL Server Authentication
- Connecting through Windows Authentication
- Connecting through Domain Authentication
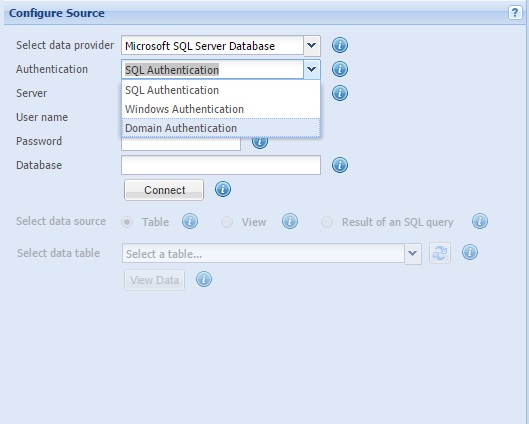
Connecting through SQL Server Authentication
When using SQL Server Authentication, you must provide your credentials (User name and password) every time you connect. This is the default authentication mode.
To connect through SQL Server Authentication mode, follow the steps below:
- Select Microsoft SQL Server Database in the Select data provider setting.
- Provide the name of the Microsoft SQL Server in the Server setting.

NOTE: Provide period (.) to access the local Microsoft SQL server.
- Enter the name of the database in the Database text field.

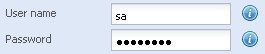
- In the User name and the Password text boxes, provide the user name and password required to connect to the database.
- Click Connect. A message box announces whether the connection is successful.
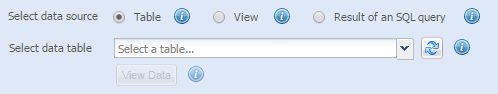
- After successful connection, in the Select data source setting, choose :
- Table option to list all the tables from the connected Database or
- View option to list all the views from the connected Database or
- Result of an SQL Query option to make use of SQL Commands to retrieve data from the Database.
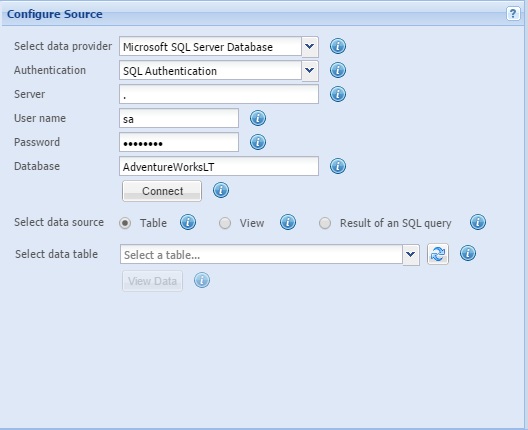
NOTE: Using Result of an SQL Query you can retrieve specific data based on a specific criteria. Here, you can make use of the advanced features of SQL Query.
The wizard with the above components is shown below:
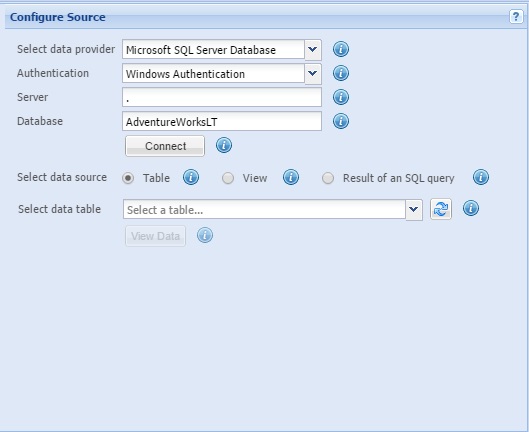
Connecting through Windows Authentication
When connecting through Windows Authentication mode, your identity is confirmed by Windows. SQL Server does not ask for the password, and does not perform the identity validation.
To connect through Windows Authentication mode, follow the steps below:
- Select Microsoft SQL Server Database in the Select data provider setting.
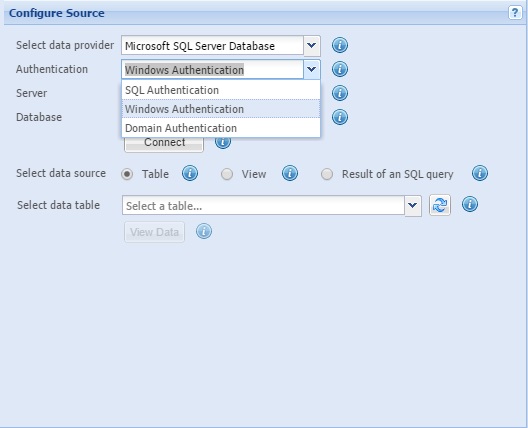
- Select Windows Authentication from the drop-down list, Authentication .
- Provide the name of the Microsoft SQL Server in the Server setting.
NOTE: Provide period (.) to access the local Microsoft SQL server.
- Enter the name of the database in the Database text field.
- Click Connect. A message box announces whether the connection is successful.
- After successful connection, in the Select data source setting, choose :
- Table option to list all the tables from the connected Database or
- View option to list all the views from the connected Database or
- Result of an SQL Query option to make use of SQL Commands to retrieve data from the Database.
NOTE: Using Result of an SQL Query you can retrieve specific data based on a specific criteria. Here, you can make use of the advanced features of SQL Query.
When this mode is selected the wizard appears as shown below:
Connecting through Domain Authentication
When connecting through Domain Authentication mode, you need to log on to the same Domain as the SQL Server to access its data.
To connect through Domain Authentication mode, follow the steps below:
- Select Microsoft SQL Server Database in the Select data provider setting.
- Select Domain Authentication from the drop-down list, Authentication .
- Provide the name of the Microsoft SQL Server in the Server setting.

- Provide the name of the Domain hosting the Microsoft SQL Server in the Domain setting.

- In the User name and the Password text boxes, provide the user name and password required to connect to the domain.
- Enter the name of the database in the Database text field.
- Click Connect. A message box announces whether the connection is successful.
- After successful connection, in the Select data source setting, choose :
- Table option to list all the tables from the connected Database or
- View option to list all the views from the connected Database or
- Result of an SQL Query option to make use of SQL Commands to retrieve data from the Database.
NOTE: Using Result of an SQL Query you can retrieve specific data based on a specific criteria. Here, you can make use of the advanced features of SQL Query.
The wizard with the above components is shown below:

How to use the Table option?
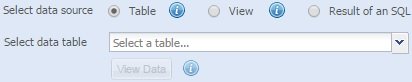
When you select the Table option, the Select data table drop-down list appears below the option. It contains the list of available database tables. Choose the required table from the list.
NOTE: You can click the Refresh button on the right to retrieve the latest tables.
Finally, click View Data to view the retrieved data.
How to use the View option?
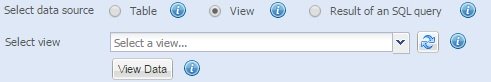
When you select the View option, the Select view drop-down list appears below the option. It contains the list of available database views. Choose the required view from the list.
NOTE: You can click the Refresh button on the right to retrieve the latest views.
Finally, click View Data to view the retrieved data.
How to use the Result of an SQL Query option?
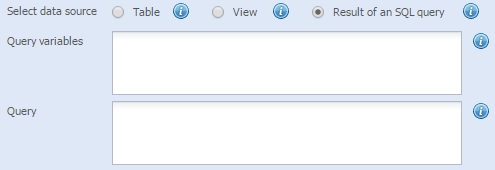
When you select the Result of an SQL Query option, two boxes, labeled Query Variables and Query, appear below the option.
To use SQL as the data source you need to do the following:
- Enter your SQL Query in the Query box.
For example, in the sample SQL Query below, we join data from two tables and get name and generated by sales managers.
SELECT TOP 100 PERCENT EMPLOYEE_MASTER.ID, EMPLOYEE_MASTER.NAME, SUM(SALES_DETAILS.AMOUNT)
FROM EMPLOYEE_MASTER, SALES_DETAILS
WHERE EMPLOYEE_MASTER.ID = SALES_DETAILS.EMPLOYEE_ID
GROUP BY SALES_DETAILS.EMPLOYEE_ID
ORDER BY AMOUNT DESC
You can optionally make use of the Query Variables box to declare variables with predefined values. These variables can then be used as part of your SQL Query.
For example, in the Query Variables box, you enter the following:
DECLARE @AGE_LIMIT int
SET @AGE_LIMIT = 18
Next, in the Query box you use this as:
SELECT NAME, ADDRESS, PHONE, DONATION FROM VISITORS
WHERE AGE >= @AGE_LIMIT
Finally, click View Data to view the retrieved data.
NEXT: Pick data fields from the Select Fields page.
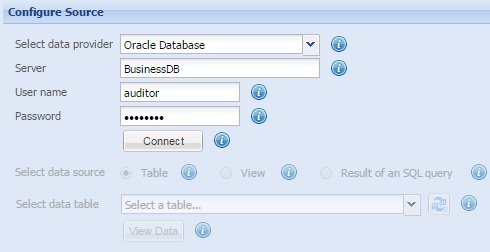
To connect to a Oracle Database and provide data to the chart, follow the steps below:
- Select Oracle Database in the Select data provider setting.
- Provide the name of the Oracle Database Server in the Server setting.
- In the User name and the Password text boxes, provide the user name and password required to connect to the database.
- Click Connect. A message box announces whether the connection is successful.
- After successful connection, under the Select data source setting, choose :
- Table option to list all the tables from the connected Database or
- Result of an SQL Query option to make use of SQL Commands to retrieve data from the Database.
NOTE: Using Result of an SQL Query you can retrieve specific data based on a specific criteria. Here, you can make use of the advanced features of SQL Query.
How to use the Table option?
When you select the Table option, the Select data table drop-down list appears below the option. It contains the list of available database tables. Choose the required table from the list.
NOTE: You can click the Refresh button on the right to retrieve the latest Tables.
Finally, click View Data to view the retrieved data.
How to use the Result of an SQL Query option?
When you select the Result of an SQL Query option, two boxes, labeled Query Variables and Query, appear below the option. Here, you need to do the following:
- Enter your SQL Query in the Query box.
For example, in the sample SQL Query below, we join data from two tables and get name and generated by sales managers.
SELECT EMPLOYEE_MASTER.ID, EMPLOYEE_MASTER.NAME, SUM(SALES_DETAILS.AMOUNT)
FROM EMPLOYEE_MASTER, SALES_DETAILS
WHERE EMPLOYEE_MASTER.ID = SALES_DETAILS.EMPLOYEE_ID
GROUP BY SALES_DETAILS.EMPLOYEE_ID
ORDER BY AMOUNT DESC
- You can optionally make use of the Query Variables box to declare variables with predefined values. These variables can then be used as part of your SQL Query.
For example, in the Query Variables box you enter the following:
DECLARE @AGE_LIMIT int
SET @AGE_LIMIT = 18
Next, in the Query box you use this as:
SELECT NAME, ADDRESS, PHONE, DONATION FROM VISITORS
WHERE AGE >= @AGE_LIMIT
Finally, click View Data to view the retrieved data.
NEXT: Pick data fields from the Select Fields page.
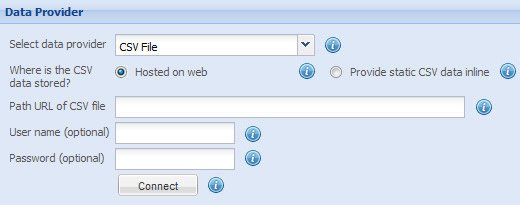
You may have your data in a text or a CSV file. You may have copied data from a Web page, a spread-sheet, etc. To use the data from the text or CSV file or to paste and use the copied data, follow the steps below:
- Select the CSV File in the Select data provider setting.
- If your data is stored locally or hosted on the Web:
- Select the Stored locally or hosted on web option.
- Enter the URL address of the CSV file in the Path URL of CSV file box.
- If the file requires a user name and password, provide the user name in the User name (optional) entry box and the password in the Password (optional) entry box.
- Click Connect. A message box announces whether the connection is successful.
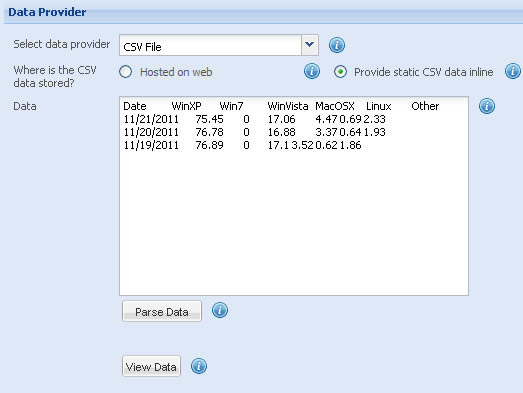
- If you have copied the data from a Web page, spread-sheet or any other source:
- Select the Provide static CSV data inline data option.
- Paste the copied data in the Data box.
- Click Parse Data. The data, which you have provided, is verified and made ready for the chart.
- Finally, view the data present in the List by clicking View Data.
NOTE: The first line of the CSV data present in your file or in the data you have pasted is considered as the header row. The header row, in a CSV data, contains the names of the data series.
To use data from Business Data Connectivity, follow the steps below:
- Select Business Data Connectivity in the Select data provider setting.
- Click Connect. A message box announces whether the connection is successful.
- Specify external system and entity in Select External System and Entity settings.
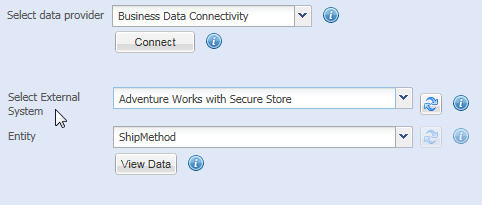
NOTE: You can click the Refresh button on the right to retrieve the latest list of External System and Entity.
Finally, you can view the data present in the List by clicking View Data.
NEXT: Pick data fields from the Select Fields page.
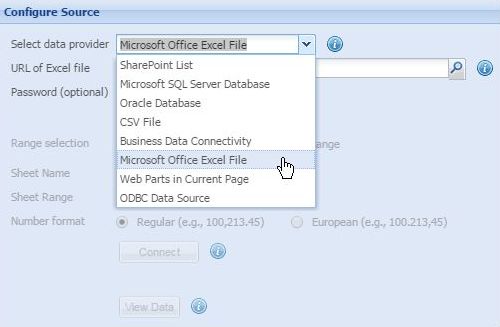
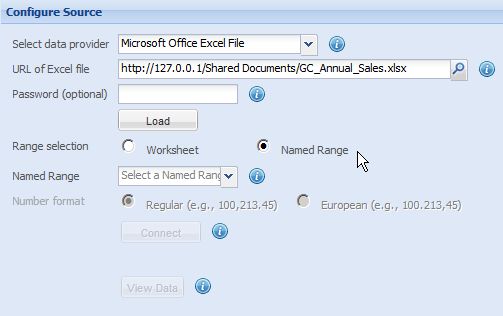
You may have uploaded Microsoft Excel Spreadsheet documents which contain data for charts on your SharePoint site or you may have such files stored in external systems on your network. To connect to a Microsoft Excel file uploaded on your SharePoint document library and use its data, follow the steps below:
- Select Microsoft Office Excel File in the Select data provider setting.
- Select the Current Site radiobutton.
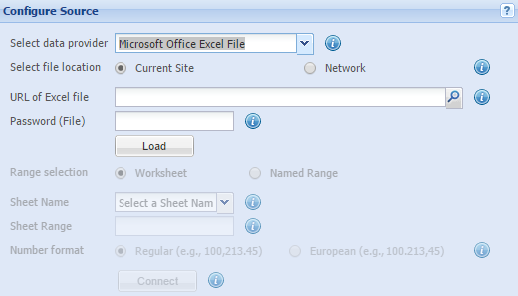
- Specify the URL of the Excel file in the URL of Excel file setting. You can also click the browse button on the right to select an Excel file.
- If the file requires a password, provide the password in the Password (optional) entry box.
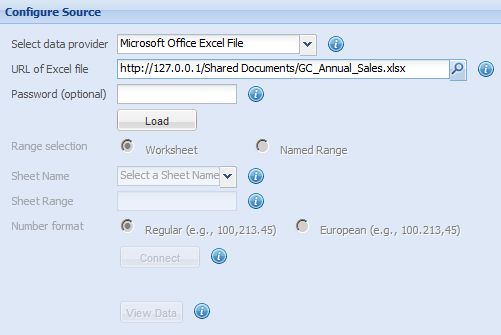
- Click Load. A message box announces whether the Excel file is loaded successfully.
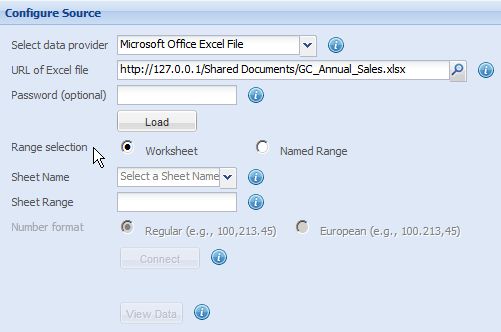
- In the Range selection setting
- Worksheet allows to select the sheet of the Excel file that contains the data for the chart.
- In the Sheet Name setting, select the sheet of the Excel file that contains the data for the chart.
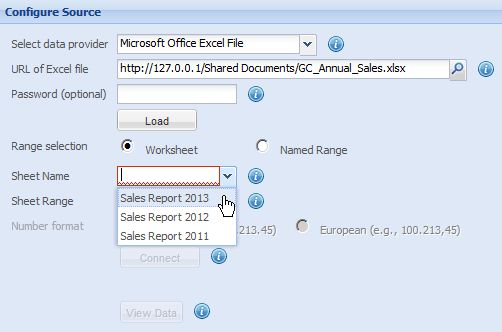
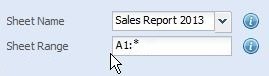
- In the Sheet Range setting, by default automatically sets the used cell range in selected worksheet or set the cell range in the selected sheet that contains the data for the chart. Sheet range also able to parse Wildcard character.

Pull all Rows & Columns data starting from "A1" selection.
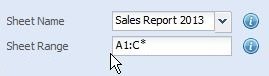
Pull all Rows data within defined Column range & starting from "A1" selection.
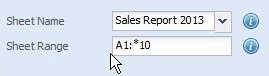
Pull all Columns data within defined Row range & starting from "A1" selection.
- Named Range allows to select the Excel named range that contains the selected data for the chart.
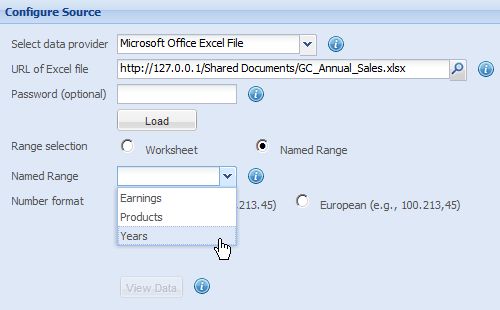
- In the Number format. Collabion Charts for SharePoint allows input setting and customizing the format of numbers of source data for the chart.
- In the Regular format: Normally, '.' (period) is used as a decimal separator and ',' (comma) is used as thousand separator.
- In the European format: ',' (comma) is used as a decimal separator and '.' (period) is used as thousand separator.

- Click Connect. A message box announces whether the connection is successful.
To connect to a Microsoft Excel file uploaded on an external location within your network and use its data, follow the steps below:
- Select Microsoft Office Excel File in the Select data provider setting.
- Select the Network radiobutton.
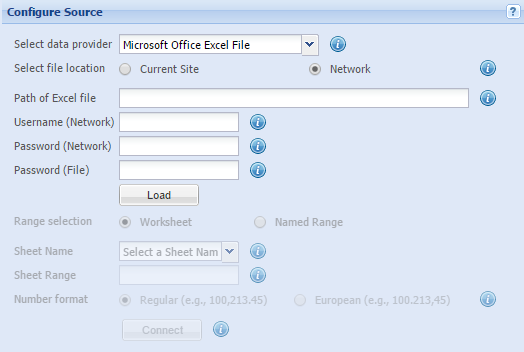
- Specify the network path of the Excel file in the Path of Excel file setting.
- To connect to the above specified network path, enter the username and password to the path in the Username (Network) and Password (Network) fields respectively. If the file requires a password, provide the password in the Password (optional) entry box.
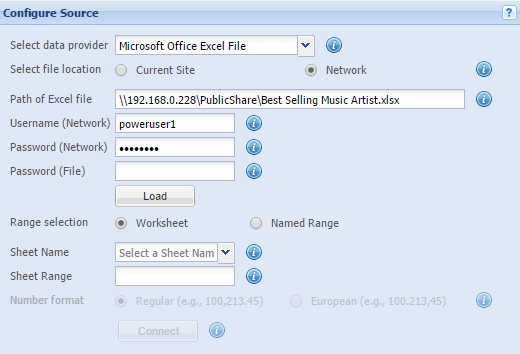
- Click Load. A message box announces whether the Excel file is loaded successfully.
- The rest of the steps are the same as before.
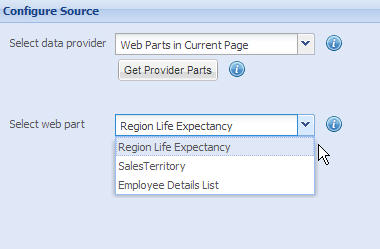
- Select Web Parts in Current Page option from the Select data provider dropdown list.
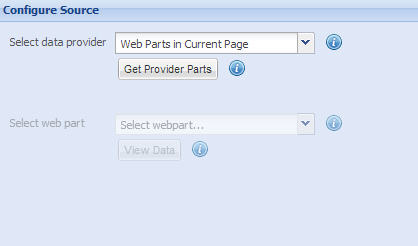
- Click on Get Provider Parts button. A message box announces whether the connection is successful. Click OK.
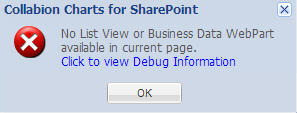
NOTE: If there is no List View Web Part or Business Data List Web Part on the page, the wizard does not allow you to proceed and terminate the process by generating an error message.
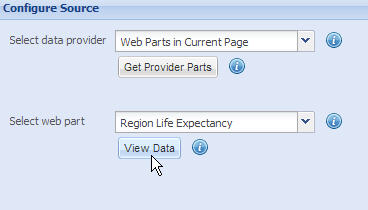
- Select the Web Part from which you want to fetch data from the Select web part dropdown list.
- Click View Data to see the data present in the List.
NOTE: If you selected any custom view while embedding the SharePoint List to the current page, the wizard will display the data within the scope of that view.
- Select ODBC Data Source in the Select data provider setting.
-
Provide the Connection String to connect with ODBC Data Source.
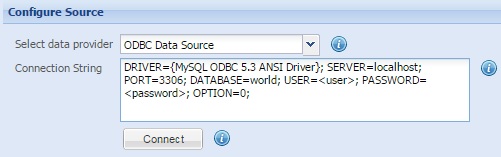
- Click Connect. A message box announces whether the connection is successful.
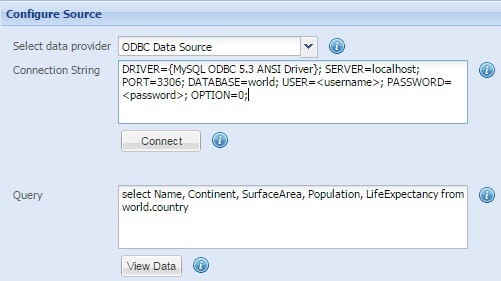
- Specify select query to fetch data.
This option allows you to fetch data from List View Web Part and Business Data List Web Part present on the same page where you intend to embed the Collabion Chart Web Part.
Finally, click Next to go to the Select Fields section of the Chart Wizard.
To use data from other data sources using ODBC connection, follow the steps below:
Finally, you can view the data present in the ODBC Data Source by clicking View Data.