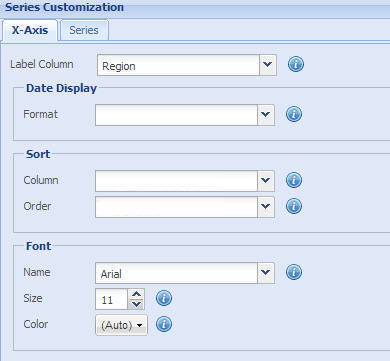
Data labels, associated with the data values of a chart, are placed along the X-Axis of the chart. X-Axis is the horizontal scale (vertical scale in bar charts) of a chart.
Data labels are also present in charts that do not have the X-Axis, like pie, doughnut, radar, pyramid, and funnel.
Learn how to:
- Specify the source of the data labels
- Define the date format of labels
- Sort the data labels
- Customize the font properties of the data labels
Specify the source of the data labels
You can specify the field or the data column of the data source from which data labels are provided to the chart.
For this, select the name of a field or data column from the Label Column drop-down list. Click Preview to view the change.
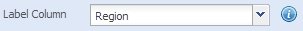
Note: The list contains the names of all the fields or data columns selected in the Select Fields page.
NOTE:
Click Apply to apply the change made.
Click Revert to undo the change.
Define the date display format of labels
If the labels of a chart show date values, you can apply a date format to the date values. The Date Display Format drop-down list provides a list of sample dates showing various standard dates.
You need to select a sample date format from the Date Display Format drop-down list. Click Preview to view the change.
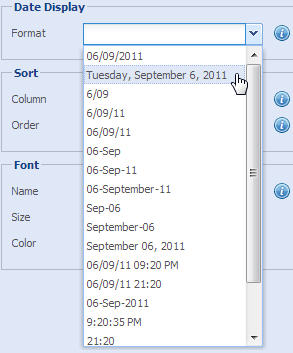
NOTE: This feature is available only when a column of Date/Time type is selected in the Label Column setting.
NOTE:
Click Apply to apply the change made.
Click Revert to undo the change.
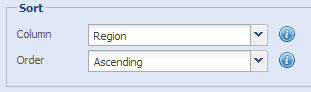
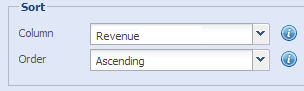
You can sort X-Axis data labels based on the values of any other column present in the underlying database, provided the field is selected while configuring the chart.
To do this, select Column and Order (ascending/descending). Click Preview to view the change.

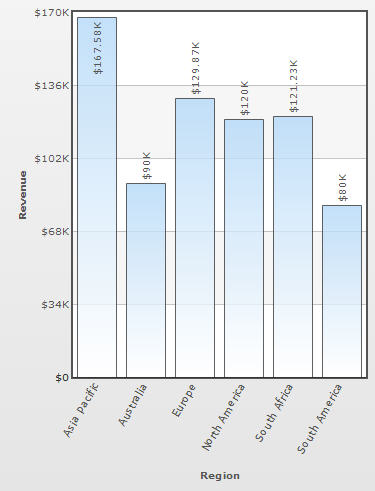
Here is a sample chart that shows Revenue earned from different Regions.

Let's arrange X-Axis data labels alphabetically. To do this, set Region field in ascending order.
This is how the chart looks now:
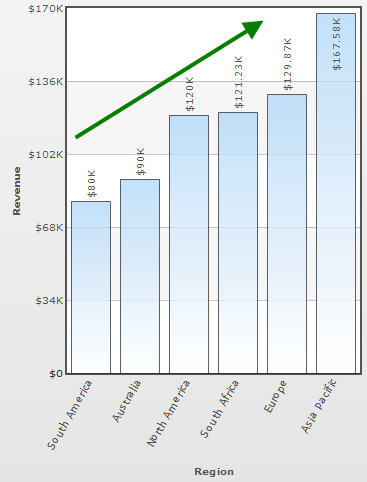
Let's sort the X-Axis data labels based on revenue so that region that generated lowest revenue appears first and second lowest next and so on.
To do this, set Revenue field in ascending order.
This is how the chart looks now:
NOTE: If you do not wish to apply sorting, simply select (None).
NOTE:
Click Apply to apply the change made.
Click Revert to undo the change.
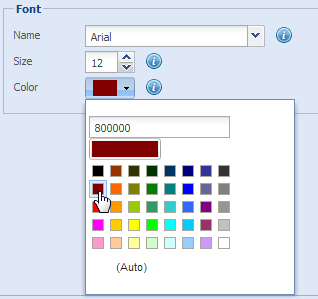
Customize the font properties of the data labels
You can customize the font properties of the data labels only in Multi Series charts. You can customize the font properties using the following steps:
- Choose the font face from the Font Name drop-down list.
- Select or enter the font size in the Font Size box.
- Select the font color from the Font Color drop-down color picker. Choose (Auto) to make the chart automatically decide the color.
- Click Preview to view the changes.
NOTE:
Click Apply to apply the changes made.
Click Revert to undo the changes.