Prepare a brilliant boardroom presentation with detailed charts built with Collabion, in minutes
Here are 5 features that can help you do that
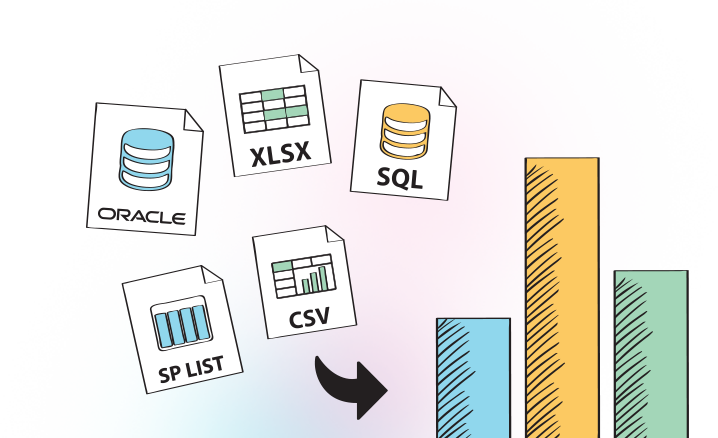
Support for most widely used data sources
From Microsoft Excel workbooks and SharePoint lists to database files from SQL Server and Oracle, Collabion supports a wide range of data sources, ensuring executives with varying degrees of technical knowledge can use it, without having to grapple with a data processing utility they are unfamiliar with. It also helps users utilize BDC, as well as connect to various external data sources via ODBC connectivity.

Plenty of chart types to choose from
Collabion Charts for SharePoint 2013 puts as many as 56 different types of charts at the user’s disposal, making it possible to always choose the right kind of chart for a given type of data. From the ubiquitous line and bar charts to specialized ones like the Pareto and Marimekko charts, any chart can be built with just a few clicks, speeding up the process considerably.

Option to dig deep into the data
Collabion makes is possible for users to apply custom data filters to the source data for a chart, thereby extracting valuable insights from it. What’s more – users also have the option to drill down into a data set, extracting extremely specific information from the lists and tables. Any filter or drill down operation applied to a data source is immediately reflected into the chart as well, which is great for presentations.

Printing charts quickly, without hassle
If certain charts do not require modification, then printing them out might help attendees prepare themselves better for intense discussions. Having printed copies at hand may also make it possible for users to take notes during meetings. Collabion makes it easy for users to print charts directly through the software, with just a few clicks.

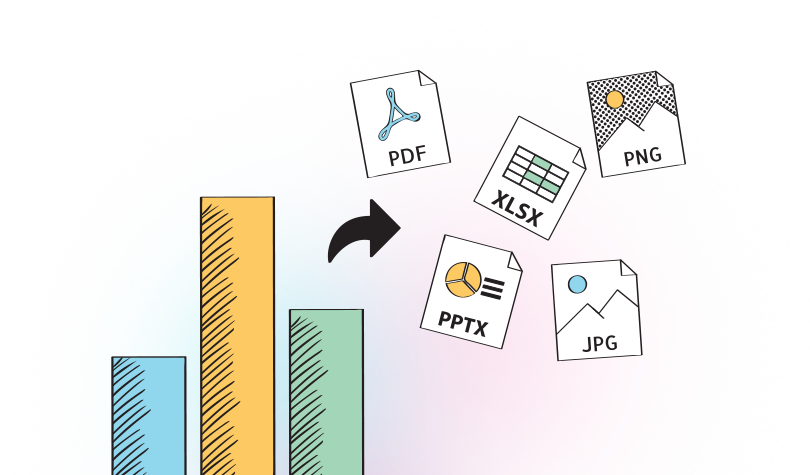
Exporting charts in widely used formats
It might be necessary for users to export charts that they build, so that those can be embedded into presentations or featured on webpages. Collabion makes it easy for users to export charts in many popular formats, including Microsoft Excel workbooks, Microsoft PowerPoint presentations, image files like JPG and PNG, and also PDF.

