What is a chart?
A chart is a graphical representation of tabulated data. The figures below show how data in tabulated form is transformed into a chart.
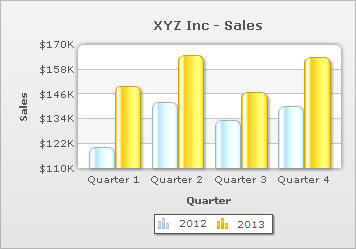
Understanding data series and categories
In the table above, columns headed '2008' and '2009' are referred to as data series. The numeric values of the series columns are called data values and these are actually plotted on the chart (as vertical bars or columns). Each of these vertical bars is referred to as dataplot. The leftmost column of the table (headed 'Quarter') is referred to as the category column. The contents of this column are called categories and they appear as data labels placed below the vertical bars (or columns) in the example chart (above).
Understanding various types of dataplots
There are various types of dataplots. The most common data plot types are:
- Column
- Bar
- Line
- Area
- Pie slice
- Doughnut slice
- Scatter plot
- Bubbles plot
There are other types of dataplots like:
- Funnel slices
- Pyramid slices
- Radar plot
Understanding the common visual elements of a chart
A chart is composed of various visual elements. The chart below shows the common visual elements.
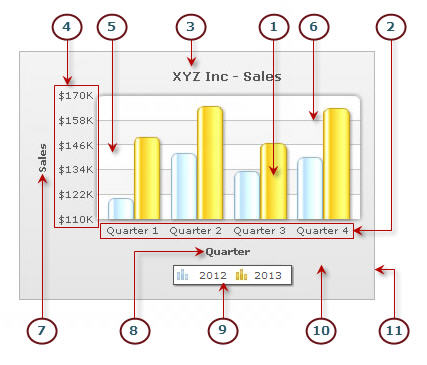
- Dataplot: Visual representation of the individual values of a chart.
- Data labels: Labels or categories associated with the data values of a chart. Data labels are mostly drawn in the X-Axis of a chart.
- Chart title: A description of a chart.
- Y-Axis scale: The numeric reference frame for the data values of a chart.
- Canvas: The main box-area of the chart where dataplots are drawn.
- Axis gird line: Horizontal lines spanning across the canvas.
- Y-Axis title: A short description of the Y-Axis.
- X-Axis title: A short description of the X-Axis.
- Legend: A small box with the data series names and the dataplot type. It helps in associating the dataplots with the data series.
- Chart background: Background of the whole chart.
- Chart border: Border of the whole chart.
Understanding axis and scale
Most of the charts have a vertical and a horizontal axis. An axis is a line beside the chart canvas used as a reference frame for the data values shown in the chart. Generally, the vertical axis (except for bar charts) is named as Y-Axis and the horizontal axis (except for bar charts) is named as the X-Axis.
The dataplots are drawn with reference to one or more numeric scales. The Y-Axis (also the X-Axis in scatter and bubble charts) acts as a numeric scale. Each scale has upper and lower limit. The scale is mostly divided into a number of smaller units. These smaller units, with respective values of the scale, help in gauging the value of the dataplots.