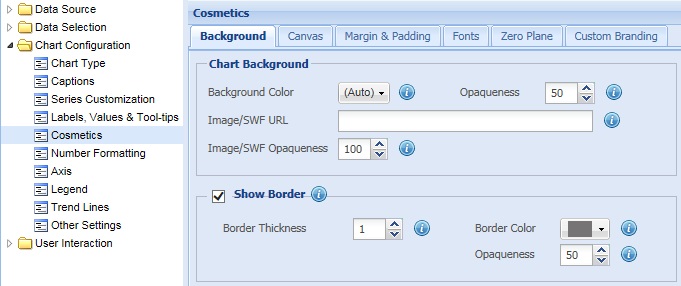
Background refers to the entire chart area on which all the chart objects such as canvas, Y-Axis, X-Axis, etc. appears.
Learn how to:
- Configure chart background
- Set an Image or SWF file as the chart background
- Show or hide the border of the entire chart area
- Configure the border of the entire the chart area
To configure the chart background you can:
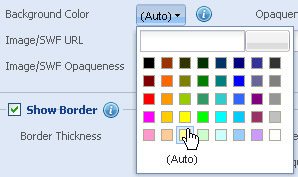
- Choose and change the background color from the Background Color drop-down color picker. Select (Auto) to let the chart decide the color automatically.
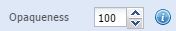
- Set the opaqueness of the background color by selecting or entering a value between 0-100 in the Opaqueness box.
The lowest value 0 will make the background color completely transparent and invisible; and the highest value 100 will make it completely opaque.
- Click Preview to view the changes.
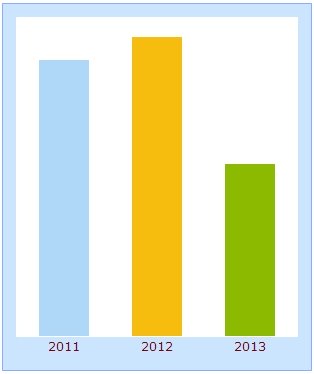
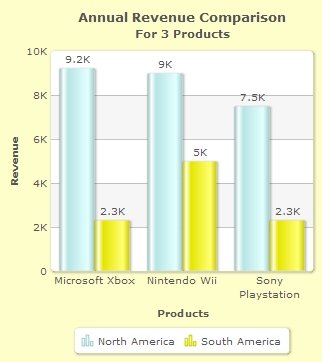
A chart with customized background looks as under:
Note:
Click Apply to apply the changes made.
Click Revert to undo the changes.
Set an Image or SWF file as the chart background
You can also use an image or SWF file as the background of the chart. Specify the path of the image in the Image URL text box and click Preview to view the change.
Note: To use an image/SWF file as background of the chart first you need to upload the image/SWF file in SharePoint Hive > TEMPLATE > LAYOUTS folder. Then, copy the location of the file and set the relative path in the URL text box.
![]()
Select or enter a value between 0-100 in the Image/SWF Alpha box to set the transparency of the background image or SWF file and click Preview to view the change.
A chart with background image will look as under:

You can also set the opaqueness of the background image. To set the opaqueness of the background image enter the value in the Image/SWF Opaqueness spin box. The value should be between 0-100. If the value is set to zero the image would appear completely transparent and if it is set to 100 the image would appear fully opaque.
Note:
Click Apply to apply the changes made.
Click Revert to undo the changes.
Show or hide the border of the entire chart area
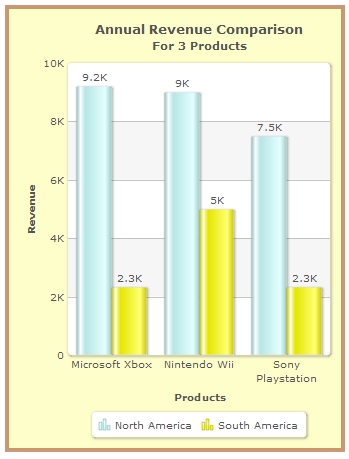
To display the border of the entire chart area, select the Show Border check box and click Preview to view the change. By default, the setting remains selected and the chart border is displayed.
![]()
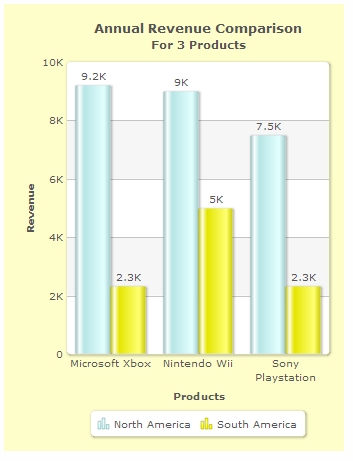
To hide the border of the entire chart area, clear the Show Border check box and Preview to view the change.
![]()
Note:
Click Apply to apply the changes made.
Click Revert to undo the changes.
Configure the border of the entire the chart area
To configure the appearance of the chart border you can:
- Select or enter a value in the Border Thickness box to set the thickness of the chart border.
- Choose and change the color of the chart border from the Border Color drop-down color picker. Select (Auto) to let the chart decide the color automatically.
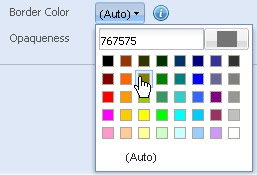
- Set the opaqueness of the chart border by selecting or entering a value between 0-100 in the Opaqueness box.
The lowest value 0 will make the chart borders completely transparent and invisible; and the highest value 100 will make them completely opaque.
- Click Preview to view the changes.
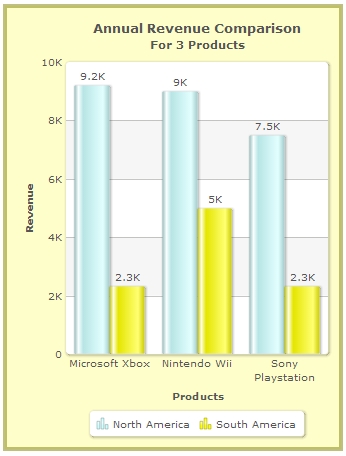
A chart with the above settings looks as under:
Note:
Click Apply to apply the changes made.
Click Revert to undo the changes.